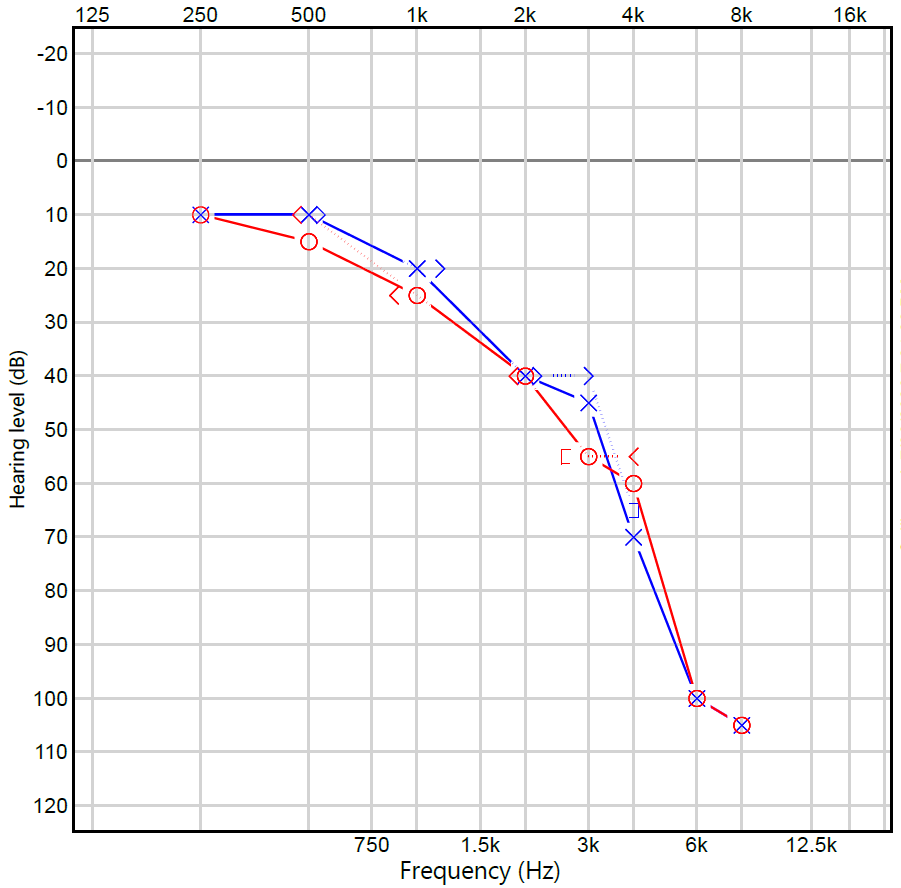
What is an Audiogram?

An audiogram is a graph of your hearing thresholds. At the end of your (or your child’s) appointment, your audiologist will explain your results to you, which includes the audiogram. Please do not hesitate to ask any questions, as your audiologist will be happy to explain the audiogram in as little or as much detail as you would like!
Here is some information to help you to better understand your results.
The horizontal lines represent Frequency (pitch), starting with the low frequencies on the left through to higher frequencies on the right – this is similar to piano keys, which go from low to high (left to right)! The vertical lines represent intensity (volume) starting with very soft sounds at the top moving through to very loud sounds on the bottom.
You may notices a few different symbols and colours on the graph. The blue ‘X’ line represents hearing thresholds in the left ear and the red ‘O’ represent hearing thresholds in the right ear. This tells us if you have a hearing loss and to what degree and if there is a significant difference between the left and right ears. The lower the symbol falls on the graph indicates that there is more hearing loss at that particular pitch in that particular ear. Normal hearing is between -10dB and 20dB, so if your symbols (X and O) fall within this range this means your hearing is within normal limits. A mild hearing loss is 25dB-40dB, moderate 45dB-65dB, severe 70dB-85dB, profound 90dB-120dB. The audiogram does not go further than 120dB, as this is the loudest volume which can be tested in clinic.
There are some other symbols you may also notice. They look they brackets <,> or [ , ]. These are the results of the bone conduction testing. Bone conduction testing tells us the type of hearing loss and if there may be anything in the ear canal or middle part of the ear blocking the sound from getting to the inner ear or hearing organ. (see article on types of hearing loss).

